Summary - KNN Algorithm
Training process and useful points to know about KNN
Terminology
$N$ - Number of data points
$X_q$ - query data points
$X_{qn}$ - nth query data point
$X$ - input train data
$D$ - dimensionality of data
$C$ - Number of classes
$C_i$ - i^th class
$N_k$ - K nearst neighbors
$m$ - Number of epochs in SGD
This blog was originally published in this link.
Algorithm
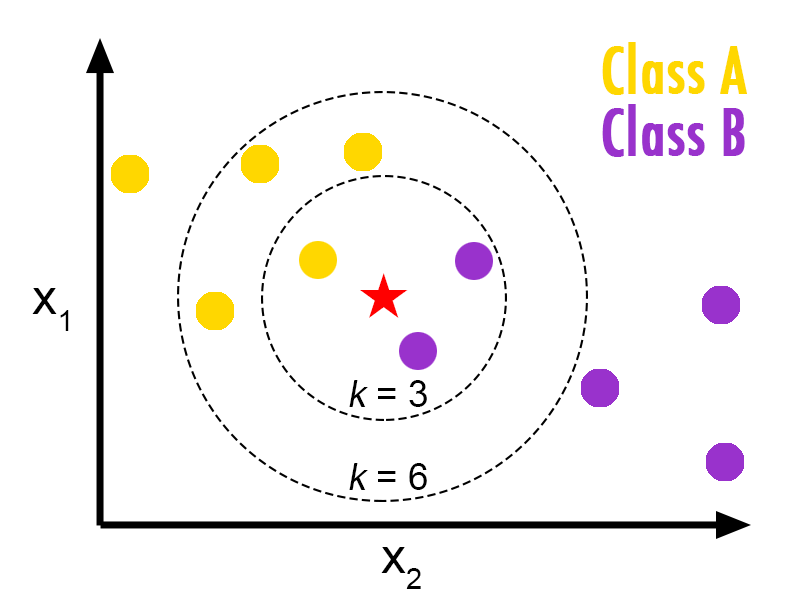
- Given a query point $X_{qn}$, find the $k$ nearest points in $X$. (You can use any distance metric)
- Count which class has maximum points in those $k$ nearest points and classify given query point $X_{qn}$ belongs to the same class. We can give weightage to the nearest points based on the distance (any function of distance).
- Probability of belonging to the specific class in a classification scenario is
\begin{align}
P(Y=C_i|X_q) = \frac{1}{K}\sum_{i\epsilon N_k}I(y_i==C_i) \\I(true) = 1, I(false) = 0
\end{align}
- If we use KNN to solve the regression problem, we can get the average of nearest points and gives as output.
\begin{align}
Y_{X_q} = \frac{1}{K}\sum_{i\epsilon N_k}y_i
\end{align}
Useful points to know
- There is no need for any specific process to work with multi-class classification because it works based on nearest neighbors.
-
There is no need for training if we want to use brute force search to get k-nearest neighbors. If we want to use Tree-based/LSH based/graph-based searching, we have to create a corresponding Tree/LSH forest/graph in the training time.
-
Testing time complexity is $O(ND)$ if we use brute force search, it is very huge if we have more data points to train. If we need less time complexity go for Tree/LSH/graph-based neighbor search. Many tree algorithms give complexity of $O(D*log(N))$.
-
It works based on distance measure so scaling the features is very important.
-
Choosing a distance metric is very crucial. If we require a rotation-invariant distance metric then Euclidean distance is one of the best choices. But in high dimensions, a curious phenomenon arises: the ratio between the nearest and farthest points approaches 1, i.e. the points essentially become uniformly distant from each other. This phenomenon can be observed for a wide variety of distance metrics, but it is more pronounced for the Euclidean metric than, say, the Manhattan distance metric. You can read more about this in this paper.
Tip: High-dimensional spaces tend to be extremely sparse, which means that every point is far away from virtually every other point, and hence pairwise distances tend to be uninformative so before applying nearest-neighbor classification it is a good idea to plot a histogram of pairwise distances of a data to see if they are sufficiently varied. -
High-dimensional spaces may not give better results so using one-hot vectors may not be useful if have more categorical variables. so, try with mean encoding/frequency-based encoding or use dimensionality reduction techniques/feature selection to get the lower dimensionality data.
-
This is not a linear model, so you can classify the non-linear data.
-
An increase in the feature value not always leads to an increase or decrease in the target outcome/probability so, it is not a monotone model.
-
It won't consider the interaction between the features. We have to create the interaction features if we need it. More interaction features may lead to less interpretability.
Hyperparameters
- K is the Hyperparameter in K-NN.
- The low value of K will give more variance to the model. increasing the K, reduces the variance, and increases the bias of the model.
- You can check the decision surface of KNN for different K values in the below image.

Interpretability
- There is a lack of global model interpretability because the model is inherently local and there are no global weights or structures explicitly learned.
- We can get interpretability based on the data we have i.e. datapoint $x_1$ is similar to the datapoint $x_2$ and $x_1$ caused $y$ so we predict that $x_2$ will cause $y$ as well. So, we can get the k nearest neighbors and we can analyze/interpret those data points.
- If we have thousands of features, it is very difficult to analyze and get interpretability.